

Shopify conversion rate is the percentage of online store sessions that end in an order. Shopify calculates it as orders ÷ sessions × 100 and shows it in Analytics as the headline number of a four-step funnel: sessions → added to cart → reached checkout → completed checkout. The average Shopify store converts about 1.4% of sessions, according to Littledata's benchmark of 2,800 Shopify stores.
One thing changed this month that every merchant reading their dashboard should know: between September 21 and 23, 2026, Shopify changed how it counts sessions, and because conversion rate is calculated from sessions, your rate may have moved without a single order changing. This guide covers the real benchmarks, how to read the number in Shopify after the change, and the fixes that move each step of the funnel.
Key takeaways
- Average: 1.4% for Shopify stores (Littledata, 2,800 stores). Above 3.2% is top 20%; above 4.7% is top 10%.
- Device gap: mobile averages 1.2%, desktop 1.9%. Judge each separately.
- Sept 21–23, 2026: Shopify now filters identified bots out of session reports by default and no longer splits sessions at midnight UTC. Your conversion rate can jump or dip with zero change in orders.
- Treat post-Sept 21 data as a new baseline. Don't compare it directly with August.
- Fix the step that leaks most, not the headline number: product page → cart → checkout.
What is a Shopify conversion rate?
A conversion rate is the share of visits that complete the action you care about. For a Shopify store that action is usually an order, so the formula is:
Conversion rate = orders ÷ sessions × 100
If your store had 4,000 sessions last month and 72 of them ended in an order, your conversion rate is 72 ÷ 4,000 × 100 = 1.8%.
Two details trip up most merchants:
- Sessions, not visitors. One shopper who visits on Sunday and comes back on Monday is one visitor but two sessions. Dividing by visitors inflates the rate. In Shopify, a session ends after 30 minutes of inactivity.
- Store conversion rate vs. step rates. Shopify also reports added to cart and reached checkout rates. They tell you where buyers drop off, which the single headline number can't.
Shopify's own guide notes that Shopify Analytics labels the metric "online store conversion rate", while Google Analytics calls it "ecommerce conversion rate". They describe the same idea, but each tool counts sessions differently, so pick one as your source of truth and track trends in it.
Average Shopify conversion rate benchmarks
The most-cited Shopify-specific benchmark comes from Littledata's study of 2,800 Shopify stores (2023 data). It is the one to use, because it measures Shopify stores rather than all of ecommerce:
| Segment | Average | Top 20% | Top 10% |
|---|---|---|---|
| All Shopify stores | 1.4% | above 3.2% | above 4.7% |
| Mobile sessions | 1.2% | — | above 3.9% |
| Desktop sessions | 1.9% | — | above 6.5% |
| Fashion stores | 1.9% | above 4.3% | above 6.1% |
| Food & beverage stores | 1.5% | above 4.1% | above 6.2% |
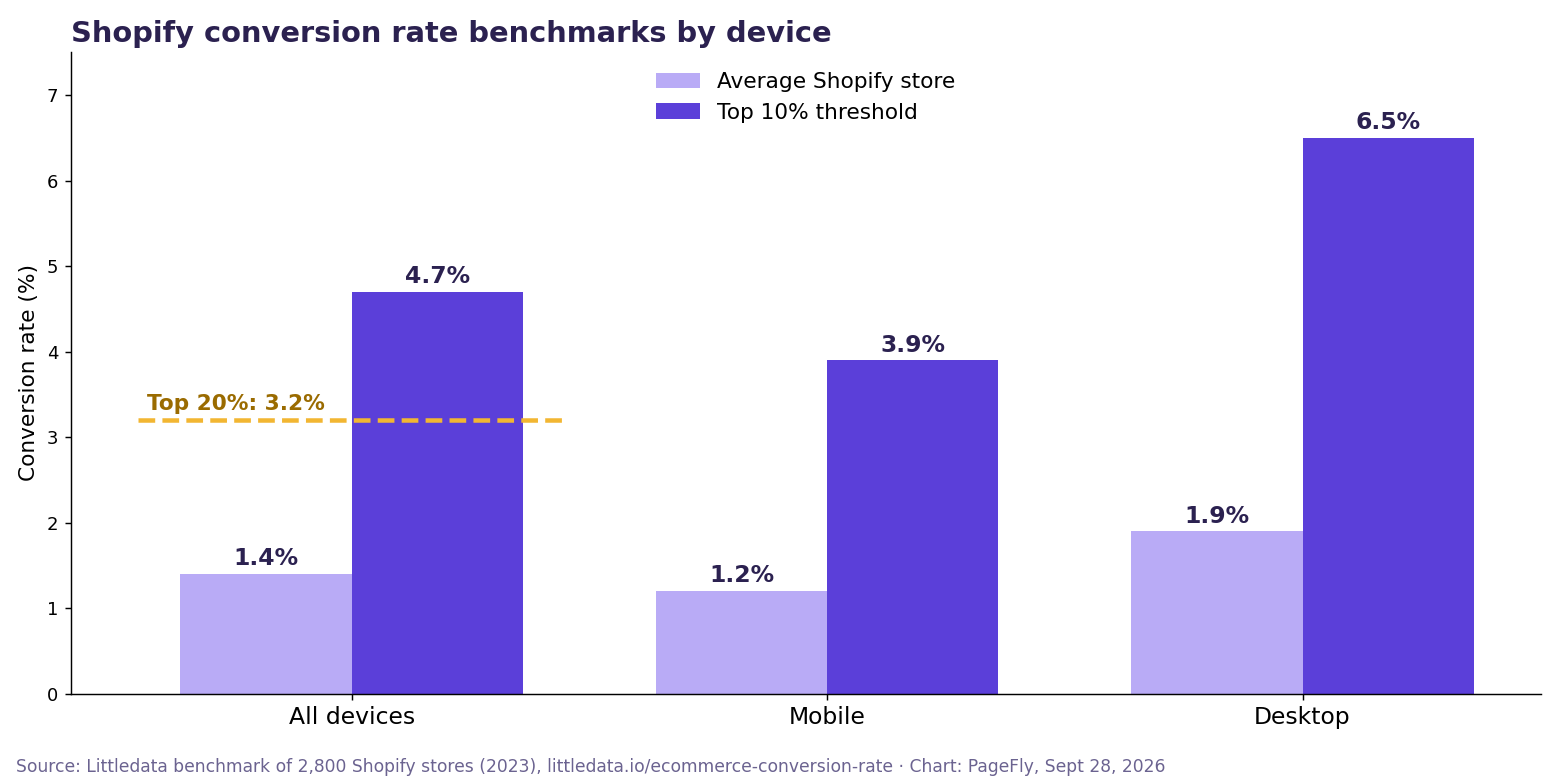
Littledata benchmarks, charted by PageFly on September 28, 2026.
Wider ecommerce studies land in the same range. Shopify's August 2026 conversion guide cites Statista at 1.4% of global ecommerce visits converting in Q1 2026, and Dynamic Yield at 2.66% across 400+ brands. Those are all-ecommerce numbers, so use them as a sanity check, not a target.
A correction from us: an earlier version of this article said the average Shopify conversion rate was 2.5–3% and attributed it to Littledata. Littledata's published figure is 1.4%. The 3.2% and 4.7% thresholds were right; the average was not. If you benchmarked your store against 2.5–3% and felt behind, you may be ahead.
What is a good Shopify conversion rate?
Anything above 3.2% puts a Shopify store in the top 20%, and above 4.7% in the top 10%. But "good" depends on three things you mostly don't control:
- Device mix. A store with 80% mobile traffic should compare itself with the 1.2% mobile average, not the 1.9% desktop one.
- Price point. Low-price, repeat-purchase products convert higher than considered purchases.
- Traffic source. Returning customers and email convert far better than cold paid social. A spike in top-of-funnel traffic lowers your rate even when sales rise.
The useful comparison is your own store, same device, same channel, month over month. Which brings us to the problem with this month.
Why your Shopify conversion rate changed after September 21, 2026
If you opened Shopify Analytics this week you probably saw this banner at the top of the page. We saw it on our own demo store on September 28, 2026:

Tested first-hand by PageFly in the Shopify admin of our Bearie demo store, September 28, 2026.
According to Shopify's Help Center, the session measurement rollout ran from September 21 to 23, 2026 and made three changes:
- Sessions follow continued activity. They no longer end at midnight UTC, so a late-night shopper now counts as one session instead of two.
- Some sessions without a pageview now count, such as a customer going straight to checkout from a cart link.
- Identified bot sessions are filtered out by default in session-related reports. Reports with a Human or bot session filter let you add them back.
Orders, sales and customer counts are not affected. Sessions are, and conversion rate is orders divided by sessions. So:
- If bot filtering removed a lot of sessions, your conversion rate goes up even though nothing improved.
- If cart-link checkouts added sessions, your conversion rate goes down even though nothing broke.
Shopify's advice is to treat data after the update as a new baseline. Here is how we'd do that.
How to reset your conversion-rate baseline
- Open Analytics → Reports in your Shopify admin and filter to the Behavior reports: Conversion rate over time, Conversion rate breakdown and Checkout conversion rate over time.
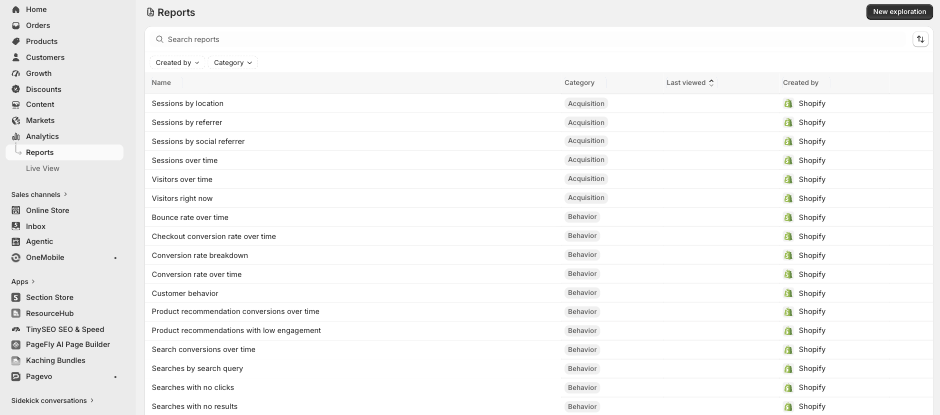
Step 1 — the conversion reports live under Analytics → Reports → Behavior. Tested first-hand by PageFly, September 28, 2026.
- Set the date range to start on or after September 23, 2026, when the rollout finished. Compare it only with another post-update range.
- Use the same Human or bot filter on both periods in reports that support it. Bot classification only exists for sessions from October 7, 2025 onward, so older periods can't be filtered the same way.
- Check orders and sales on the Analytics overview for the same dates. If sessions moved but orders didn't, the update explains the change. Your store didn't get better or worse.
- Write down the new numbers (conversion rate, add-to-cart rate, reached-checkout rate) as your baseline for the next A/B test or page change.
On the Conversion rate over time card, Shopify now draws a Definition change line at September 21 so you can see exactly where old and new measurement meet:
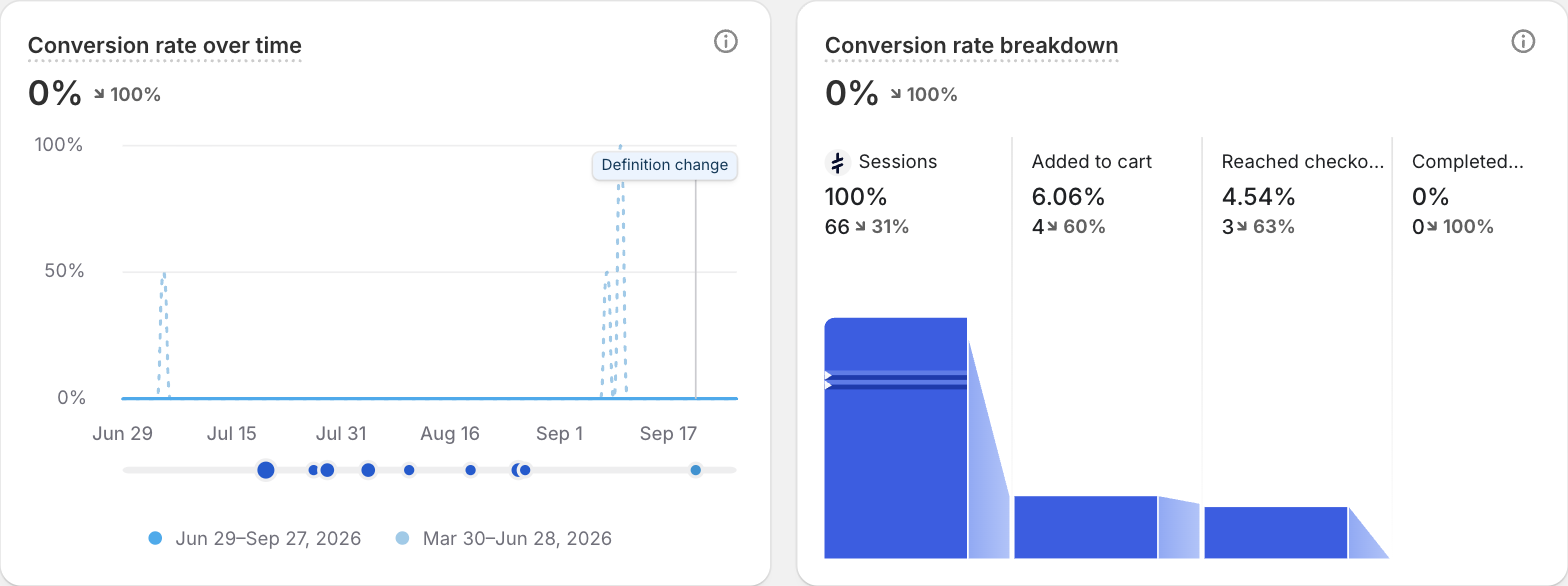
Step 5 — the conversion rate breakdown for Jun 29–Sep 27, 2026 on our Bearie demo store. Tested first-hand by PageFly, September 28, 2026.
Our demo store isn't a real business, so its numbers are small: 66 sessions, 4 added to cart (6.06%), 3 reached checkout (4.54%) and 0 completed checkouts. But it shows how to read the card. The breakdown tells you the funnel broke after checkout started, which points to a checkout problem, not a product-page problem. That's the diagnosis the headline 0% hides.
How to find where your funnel leaks
Every conversion fix works on one step of the funnel. Read the Conversion rate breakdown card, find the biggest drop, and start there:
| Biggest drop | What it usually means | Where to fix it |
|---|---|---|
| Sessions → added to cart | Wrong traffic, or the landing/product page doesn't answer "is this for me?" | Product page, landing page, offer |
| Added to cart → reached checkout | Surprise costs, weak cart, hesitation | Cart page or drawer, shipping message |
| Reached checkout → completed | Payment options, forced accounts, trust | Checkout settings, payment methods |
Shopify's guide cites the Baymard Institute's finding that extra costs such as shipping, tax or fees are the top reason US shoppers abandon checkout (39%), which is why the middle row is so often the real leak.
How to improve your Shopify conversion rate
Once you know which step leaks, these are the fixes that move it. They're ordered by funnel step.
1. Match the landing page to the traffic
Visitors from a Google search and visitors from a broad paid-social ad arrive with different intent. Send paid traffic to a dedicated landing page whose headline repeats the ad's promise instead of your homepage. Tag every campaign with UTM parameters so you can compare conversion rate by source inside Shopify Analytics. Organic visitors tend to arrive with clearer intent, so it pays to grow organic traffic alongside ads.
2. Make the next step obvious
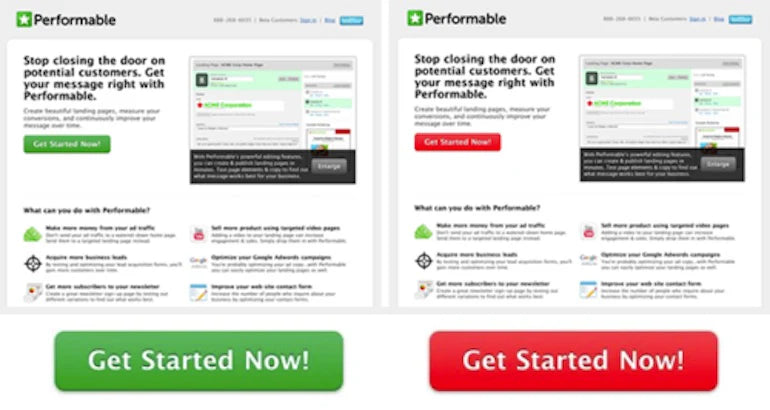
A hero banner with no button leaves shoppers guessing. Every key section needs one clear call to action that says what happens next ("Shop the collection", "Add to cart"), in a colour that contrasts with the page.
3. Build product pages that answer objections
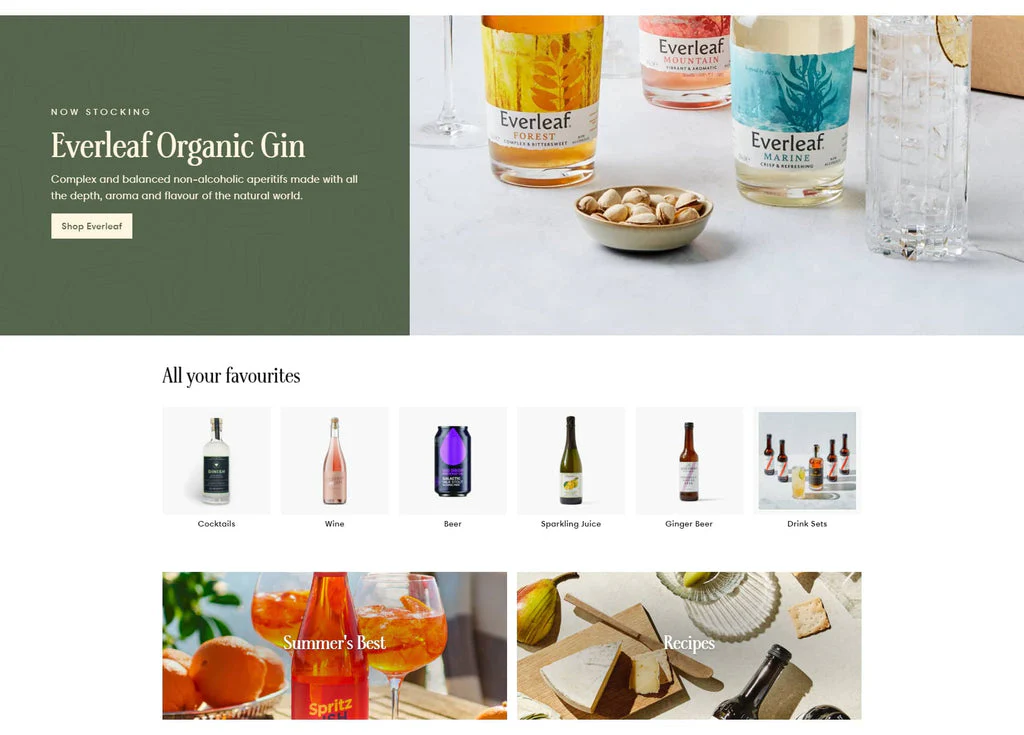
The sessions → cart drop is usually a product-page problem. Use several high-resolution images and a short video, write benefit-first descriptions, and place reviews and customer photos near the price and the Add to cart button. Our best Shopify product page examples show how real stores do it, and the product page SEO guide covers the on-page checklist.
A sticky Add to cart bar also helps on long mobile pages, where the button scrolls out of view.
4. Show the full price before the cart
Because surprise costs are the top abandonment reason, state shipping costs and free-shipping thresholds on the product page and in the cart. Decide between a cart page, drawer or mini cart based on how many items people usually buy.
5. Remove friction from checkout
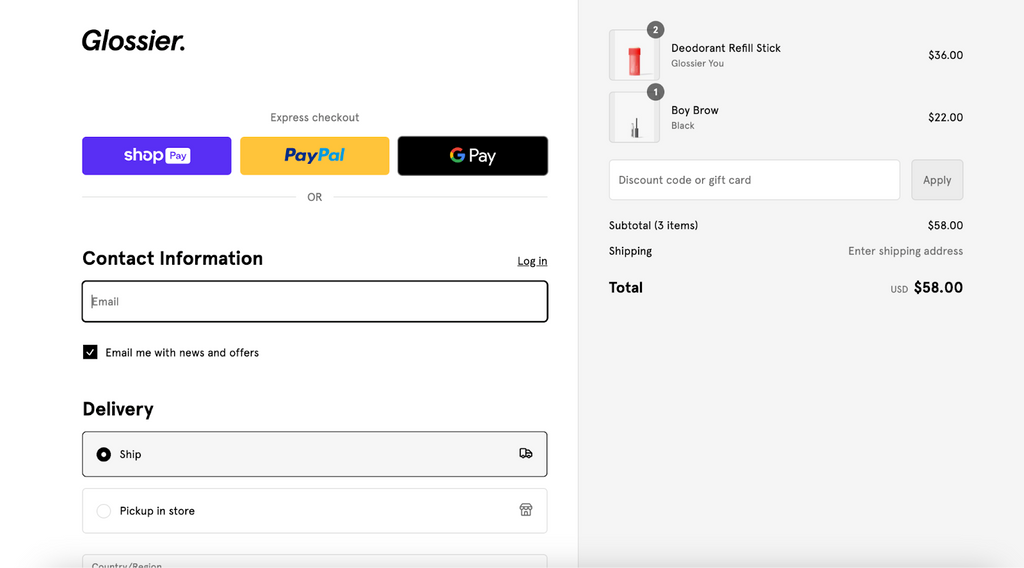
Keep guest checkout on, offer the wallets your customers already use (Shop Pay, Apple Pay, Google Pay, PayPal), and don't ask for fields you don't need. The Shopify checkout page guide covers what you can and can't customize. Turn on Shopify's built-in abandoned checkout emails, then see our abandoned cart recovery guide for timing and incentives.
6. Add trust where hesitation happens
Reviews, clear return policies and recognizable payment logos work best next to the price, in the cart and at checkout, the three moments a shopper decides. Ask recent buyers for reviews regularly so the feedback stays fresh.
7. Design for mobile first
Mobile converts below desktop (1.2% vs 1.9% in Littledata's data), yet it brings most of the traffic. Check every page on a phone: tap targets, image weight, and whether the Add to cart button is visible without scrolling.

8. Test one change at a time
Run A/B tests on one element per test (headline, hero image, CTA, price display), and only compare periods measured the same way. After September 21 that means both variants must sit on the new session definition. For the method, read our Shopify A/B testing guide.
How PageFly helps you lift conversion rate
Most of the fixes above are page fixes: a landing page that matches the ad, a product page that answers objections, a clearer call to action. PageFly is a Shopify page builder for exactly that work. You can start from a conversion-focused page template instead of a blank page, edit it with drag-and-drop, and test page variants with PageFly's built-in A/B testing on eligible plans.
See PageFly pricing for which plan includes what, or the PageFly CRO overview for the full toolkit.
Whatever you change, measure it against your post-September 23 baseline, for at least two weeks, on the same device and channel.
Shopify Conversion Rate FAQ
About 1.4% of sessions, according to Littledata's benchmark of 2,800 Shopify stores. Mobile averages 1.2% and desktop 1.9%.
Above 3.2% puts a Shopify store in the top 20%, and above 4.7% in the top 10% (Littledata). Compare against your own device mix and traffic sources, not a single global number.
Shopify rolled out a new session measurement from September 21 to 23, 2026. Identified bots are filtered out of session reports by default and sessions no longer end at midnight UTC. Conversion rate is orders divided by sessions, so it can move even when orders don't.
Divide orders by sessions for the same period and multiply by 100. Shopify Analytics does this for you in the Conversion rate over time and Conversion rate breakdown reports.
In your Shopify admin, go to Analytics for the overview cards, or Analytics > Reports and open the Behavior reports: Conversion rate over time, Conversion rate breakdown and Checkout conversion rate over time.
Find the biggest drop in the conversion rate breakdown first. Fix product and landing pages for the sessions-to-cart drop, show full costs for the cart-to-checkout drop, and simplify payment and guest checkout for the final step. Test one change at a time.