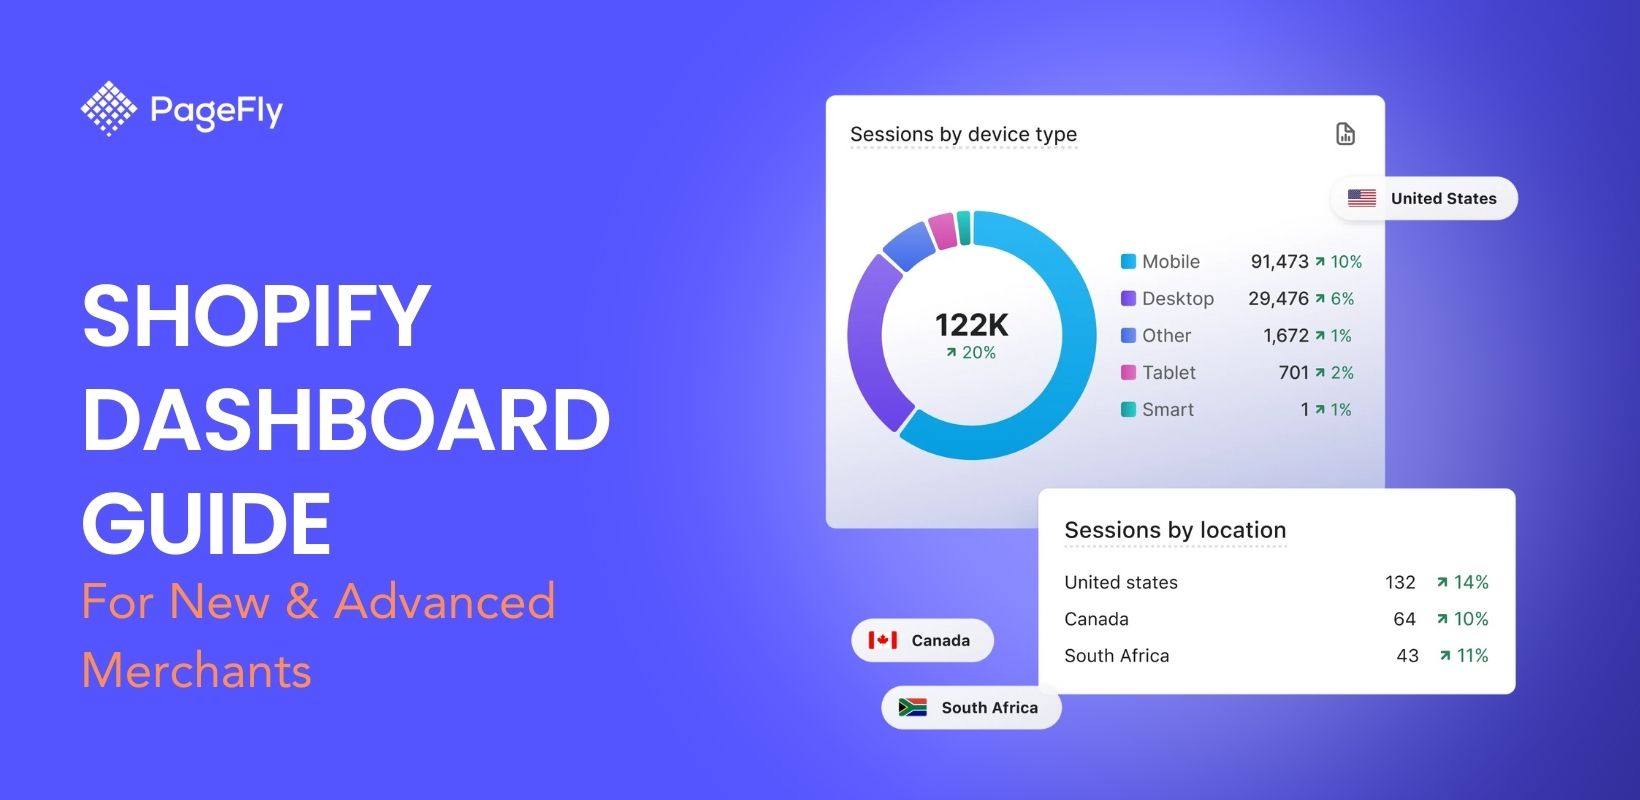
The Shopify dashboard is an all-in-one tool that allows you to manage all the intricacies of running an ecommerce business. Luckily, it’s relatively easy to use. Let’s talk about it in this article.
Shopify is the most popular and trusted platform for ecommerce businesses, offering powerful features and a rich ecosystem of apps, themes, and developers. Its dashboard provides real-time data, enabling business owners to make informed decisions and track their business performance down to the last cent. However, what primarily attracts new entrepreneurs to the Shopify platform is its simplicity. In fact, even if you’re an absolute beginner, you’ll easily find your way in it.
That’s all thanks to Shopify’s simplified dashboard. It’s your primary access for customization, sales and marketing, store management, and more. It contains many reports and metrics you can customize to your needs depending on crucial data you need to see about your site.
Despite its relative ease of use, you might still find yourself lost in it every once in a while. That’s why in this guide, we'll give you a tour of your online store dashboard and show you all the things that you can do with it.
Let’s begin.
What is the Shopify Dashboard?
Before we start our Shopify dashboard tour, let’s first talk about the major role it plays in running an ecommerce business with Shopify.
Imagine building an online store as building a house. Your Shopify dashboard is the toolbox that contains everything you’ll need to build that house.
As such, you’ll find all kinds of tools in your Shopify dashboard such as:
- Traffic data about your online store conversion rate and online store sessions.
- Reporting tools for valuable metrics such as total sales, returning customers, and top landing pages.
- Monitoring tool for received and fulfilled orders.
- Sales and marketing integration for your sales channels and when running campaigns.
- Access to customization tools to enhance your online store, and more.
With that in mind, mastering how to maximize the tools in your Shopify dashboard is crucial if you want to succeed in your ecommerce business.
For that, let’s begin our exploration.
Note: The screenshots in this article were taken from our demo store. Your Shopify dashboard might look differently because of its content. Nonetheless, all the functions will be the same.
Shopify Admin Dashboard
To go to your Shopify dashboard, simply log in to your Shopify account. As soon as you’re logged in, you’ll be able to access your Shopify dashboard.
The default landing page of your Shopify dashboard is the Home.

In your Shopify dashboard home, you will see a collection of data about your Shopify store such as some analytics that summarize the performance of your ecommerce business depending on the time range that you set. You can also change the data that you want to see by clicking on the report title and choosing another type of report.
Moreover, you can also view the same reports on your different sales channels (if you are using multiple channels) by clicking on the drop-down option beside the time range.
Lastly, the Shopify dashboard acts as a notification center for new updates and store setup.
Orders Dashboard
The next item in your Shopify dashboard will be the Orders Dashboard. This menu item shows you all sorts of data about all the orders received by your shop.

Upon first clicking the orders dashboard, you will be presented with a complete report of all orders from your customers. Here, you can view all the orders received by your ecommerce business as well as their status whether they are already fulfilled, unpaid, or delivered.
If you have multiple fulfillment locations, you can choose to view specific data for those locations by clicking on All locations and selecting the location that you want to view.
Drafts
Within the drafts menu, you can create custom orders from customers. This is particularly useful when you run a wholesale or B2B business. Or if you accept custom orders that are not available in your store.
Shipping labels
Below the drafts menu is the Shipping labels. This is the dashboard where you can purchase shipping labels from your partner shipping carriers. Such as if you are using Shopify shipping for your business.
Abandoned checkouts
And lastly, the Abandoned checkouts menu shows you a report of all unfinished checkouts in your online store. These unfinished checkouts appear when your customers add items to their carts but do not proceed with the purchases.
Products Dashboard
The next item in your Shopify dashboard is the products dashboard. This is where you can see all the data related to your products and more.

Upon clicking the products dashboard, you will immediately see a list of all the products in your shop including their inventory level on every sales channel that you have.
At the top of the dashboard is a mini section for analytics that shows the sell-through rate to show which product is purchased most by your customers.
Moreover, if you’re introducing new products in your ecommerce business, this is the dashboard where you create them.
Collections
Under the products menu is theCollections menu. This menu shows pages in your store that show a grouping (or collection) of your products that are sorted together based on how you organize them.
In Shopify, you can automate product collections using categories and tags.
Inventory
Within the inventory menu, you will see a report of your products sorted by fulfillment location. As such, the list of products that you’ll see depends on the inventory that you have for the specific location.
Purchase orders
Within the purchase orders menu is where you’ll see the status of the orders that you've placed on your suppliers' websites (if they have a system that integrates with Shopify).
Transfers
Under the transfers menu, you can create transfer orders to move your products from one location to another. Again, this feature is only useful if you have multiple fulfillment locations or if you have physical stores.
Gift cards
Lastly, under the Gift cards menu, you can create custom gift cards that you can send directly to your loyal customers. You can customize these gift cards to have a certain value in dollars as well as the expiration dates.
Customers Dashboard
After products, the next one in your Shopify dashboard is the Customers dashboard. This is where you’ll see comprehensive data of customers that you have ever had in your online store.

Your store automatically fetches information as soon as customers buy from your online store. Additionally, this list also includes potential customers who haven’t purchased from your store yet but have made contact with you via Shopify Inbox.
Under the email subscription column, you will see if these customers have subscribed to your email campaigns or not. Additionally, if they placed an order, their addresses appear under the location column.
Below the orders column, you’ll see the order quantity your customers have. Lastly, under the amount spent column, you’ll see the total amount your customers have spent in your shop.
Segments
Also within the customers dashboard is the Segments menu.
This is yet another powerful automated feature in your store that could help you craft impactful campaigns for your ecommerce business.
Within segments, Shopify automatically segments your customers according to the following parameters such as:
- Customers who have purchased more than once
- Email subscribers
- Abandoned checkouts in the last 30 days
- Returning customers, etc.
Moreover, if you want to create segments for your customers, you can create a new segment using templates, filters, or custom code.
Content Dashboard
Upon clicking the content dashboard, you’ll be directed to the metaobjects menu.

Metaobjects
Metaobjects are flexible and customizable structures in your shop that allow you to store and manage additional information for your store such as:
- Product information
- Features
- Specifications
- Size charts, and more.
Files
Within the files menu is where you will find all the multimedia files that you have uploaded to your store such as images and videos. You can also upload additional assets in this menu if needed.
The Shopify sales dashboard offers several benefits, including providing a single source of truth for your business data, enabling faster decision-making, and offering actionable insights for various departments. It also facilitates more effective data-focused collaboration and supports long-term business sustainability.
Analytics & Shopify Sales Dashboard
This section provides crucial data for decision-making, including total sales, average order value, and conversion rates. You can customize it to suit your business needs by adding or removing metrics.
From this menu, you can find crucial data that will help you decide on future actions such as marketing campaigns, store expansion, and more.

Analytics
Upon clicking the Shopify analytics dashboard, you’ll be greeted by different types of reports that you want to see in your business.
To customize your Shopify dashboard, log in to your Shopify account, navigate to the Analytics menu, click Customize, and select the metrics you want to display. This allows you to create a tailored view of your business performance, including sales, traffic, and customer data. You can do that by clicking the Customize button.
Additionally, if you want to see information within a certain time range, you can set it by clicking the buttons on top of your analytics page.
Reports
The reports menu includes 11 types of sales reports, such as sales over time, by product, by product variant SKU, and by traffic referrer. These reports help you analyze your sales performance and identify trends. You can add these in your analytics dashboard for a quick view.
The information that you can view from these reports includes:
- Customers (by location, name, spend tier, etc.)
- Sales by category, total sales
- Top landing pages
- Top referrers of traffic to your site
- Online store session
- Online store conversion rate
- Taxes paid depending on location
- Shipping
- Fraud analysis
- Average sales per day
- And a lot more
Live View
Within the live view menu of your Shopify dashboard, you can see events in your online store as they happen. Some information that you can see here includes:
- Current visitors
- Total sales
- Total sessions
- Total orders
- Location of your current visitors
Additionally, you can see the progress of your customer sessions such as:
- Active carts
- Checking out
- Purchases
Marketing Dashboard On Shopify
The marketing dashboard provides detailed insights into the effectiveness of your marketing efforts, showing metrics like online store sessions, conversion rates, and sales attributed to marketing campaigns. You can use this data to optimize your marketing strategies. This includes:
- Online store sessions
- Online store conversion rate
- Average order value
- Total sales
- Sales attributed to marketing
- Orders attributed to marketing
But unlike the Analytics menu, the insights shown here are more detailed to reflect the impact of your marketing efforts to see if they are working or not.

Campaigns
The campaigns menu in your Shopify dashboard will show you all the active campaigns in your Shopify store.
If you click on any of those campaigns, you’ll be greeted by an analytics dashboard that presents data that specifically refers to that campaign.
Automations
Within the automations menu of your Shopify dashboard, you’ll see preset marketing automations for your Shopify store that automatically fetch data as events occur.
There are also a lot of templates available here. Some of them are:
- Browser push notification
- Email upsell
- Abandoned cart recovery
- Post-purchase thank you
- Customer win-back
- And more
Discounts Dashboard
The discounts dashboard is where you can create discounts on your products.

Sales Channels Dashboard
Another crucial part of your Shopify dashboard is the sales channel dashboard. This is the place to go for store customization.
When you click the sales channel dashboard, the default view would be the Online store menu. And if you have other sales channels installed on your store, you can also find them here.
Below, you can see that our demo store has multiple sales channels such as Shopify Inbox, Shop App, and Google & YouTube.
But if you just launched your Shopify store and you haven’t installed anything yet, you’ll only see the Online store menu.

Online store
The online store menu is your gateway towards customizing your store. The default view of your Online store menu is set under the Themes sub-menu.
Themes
Here, you can see the list of themes that you have installed in your Shopify store (under the Theme library section). If you’ve just started, you will only see the theme that you chose upon signing up on Shopify.
Also, the themes menu is where you should go if you want to customize your online store.
Simply click the Customize button and you’ll be redirected to your Shopify theme editor.
Blog posts
If you plan to publish blogs on your Shopify store, click the Blog posts menu and you will be redirected to a page within the Shopify admin where you can write your blog posts.
Trivia: Did you know that you can write blog posts using AI right within the Shopify admin? You can do that by using Shopify Magic.
Pages
Under the pages menu, you can create additional landing pages in your online shop. Knowing how to create pages in your online store is crucial because you will need this when getting the navigation of your store organized.
Navigation
The navigation menu is where you organize the structure of your website. This is where you arrange your menu items, and fix your website’s structure.
Also, when you create new pages, this is where you fix how that page is accessed in your Shopify store.
Apps Dashboard
The apps dashboard shows you all the apps that are installed in your Shopify store.

When you click the apps Shopify dashboard, it will automatically pull out the search bar and it will show you a list of the apps that you have installed in your Shopify store.
As such, it acts as a quick access button if you need to adjust the settings of your current apps.
For more advanced reporting and customization, consider using third-party apps like Data Export IO, Report Pundit, or Better Reports. These apps offer features such as data export, report filtering, and multi-format file exports
Profile Settings
Another element of your Shopify dashboard is the profile settings button which you can find in the upper-right corner of your admin. This is a sticky header so you can access it wherever you are in the Shopify admin dashboard.

Within profile settings, you can access:
- All your existing Shopify stores
- Help center and community forums
- Changelog
- The Shopify Partners directory if you want to hire Shopify developers
- Account management
Settings
The settings button in your Shopify dashboard is where you access additional tools that are important to getting your Shopify store up and running as well as maintaining it.

The settings button contains a collection of tools – all of which are crucial to know. To get started with your Shopify store settings, click the Settings button on the lower-left corner of your screen.

From the settings menu, you can access menu items to access the following things:
- Account management
- Users and permissions
- Payment gateways
- Customer accounts
- Shipping settings
- Tax settings
- Locations
- Create and manage markets
- App management
- Domain
- And other important aspects of your Shopify store
Dashboard Search Bar
Lastly, the final element in your Shopify dashboard is the Search bar.

The search bar is a tiny element located at the top-center portion of your Shopify dashboard. This simple search bar elevates the convenience of managing your online store.
From the search bar, you can:
- Search any content in your Shopify store including products, collections, apps, and themes
- Access the help center
Conclusion
There you have it, you’ve completed the tour in your Shopify dashboard. You should now be able to navigate your way through managing a Shopify store now that you know what each menu item in the Shopify store represents.
Mastering the Shopify dashboard is crucial for ecommerce success. By leveraging its analytics and sales features, you can make informed decisions, optimize your business, and drive growth. Explore the dashboard regularly to unlock its full potential. Thus, we encourage you to explore your online store dashboard to have an easier time managing your store in the future.
And for quick access, bookmark this page when you need it.
For more factual information about Shopify, visit the Shopify Help Center.
Shopify Dashboard FAQ
Yes, Shopify has a dashboard. The Shopify dashboard (also called the Shopify admin) contains all the tools needed to manage your online store.
The Shopify dashboard is very easy to access. Simply log in to your Shopify account and you’ll be able to access your admin dashboard.
If you want to customize the layout of your Shopify store, you need to access the theme editor.
To do that:
- Log in to your Shopify dashboard.
- Click the Online store menu in the left side of your admin.
- Under the online store menu, click the themes sub-menu.
- In the themes dashboard, click the Customize button and you will be redirected to your theme editor.


![27 Best Shopify General Stores + Complete Strategy Guide [2025]](http://pagefly.io/cdn/shop/articles/Best_Shopify_General_Stores_2f9d09f2-7c38-4da9-a495-e9f4898ddd68.jpg?v=1757271936&width=1640)


