This is a guest blogging article contributed by Stephen Courtney
Shopify reports show you which of your products are selling, when you get the most sales and where your visitors come from. Understanding how your store works using Shopify reporting can help you reduce unnecessary spending and increase your Shopify conversion rate. This article gives you step-by-step instructions on how to make sense of your store using Shopify basic reports and Shopify professional reports. This article gives you step-by-step instructions on how to make sense of your store using Shopify reports.
Optimizing a Shopify store takes time. It is done by making small improvements on a “test-and-learn” basis. Shopify reports can help to show you where to focus your effort, and whether the changes you make are having a positive impact. However, the first step is to make sense of your data.
Further reading: Everything You Need To Know About Shopify Conversion Tracking
I. What Are Shopify Reports and How Do They Work?
Shopify reports organize your store’s data into meaningful graphs and tables. For example, the “Sessions Over Time” report shows you how many visitors your store received each day over a given period.

The Basic Shopify plan includes 'Sessions Over Time' as part of your Acquisition reports, which are essential elements of Shopify basic reports. It also comes with Behaviour, Finances, Marketing, and Inventory reports, all crucial aspects of Shopify reporting. It also comes with Behaviour, Finances, Marketing and Inventory reports.
Discover the Best Shopify spy tools for your business!

There are a number of different kinds of Shopify reports, and some of them are only available for customers with a particular Shopify plan. For example, Sales Reports (which show you detailed information about individual transactions) are only available to users on the Shopify Plan.
| Feature Category | Basic Shopify | Shopify | Advanced Shopify | Shopify Plus |
|---|---|---|---|---|
| Overview | $39/month (annually) $49/month (monthly) | $92/month (annually) $105/month (monthly) | $299/month (annually) $399/month (monthly) | Custom pricing Starting at $2,300/month |
| Products | Unlimited products 2 staff accounts | Unlimited products 5 staff accounts | Unlimited products 15 staff accounts | Unlimited products Unlimited staff accounts |
| Marketing | Basic marketing tools Basic reports | Professional marketing Professional reports | Advanced marketing Advanced report builder | Enterprise marketing Custom reports |
| Behaviour | Abandoned cart recovery Basic customer insights | Abandoned cart recovery Customer insights | Abandoned cart recovery Advanced customer insights | Advanced analytics Custom insights |
| Sales | Online and in-person sales 2% transaction fee | Online and in-person sales 1% transaction fee | Online and in-person sales 0.6% transaction fee | Omnichannel sales Lowest transaction fees |
| Custom | Basic customization Limited reports | More customization Enhanced reports | Advanced customization Customizable reports | Full customization Complete control |
II. What Is The Difference Between Reports and Dashboards?
Some of your reports are available as dashboards. The dashboard page displays a number of the graphs and tables from your reports on a single page. That way, you can see how your key performance metrics are changing over time and draw conclusions about your website as a whole.
You can access your reports and dashboards from the “Analytics” section of your Shopify workspace.

III. Understanding Your Shopify Reports: Jargon Buster
Shopify reports often use specialist marketing terms without explaining exactly what they mean. This section will help you to make sense of all the terms used in your reports.
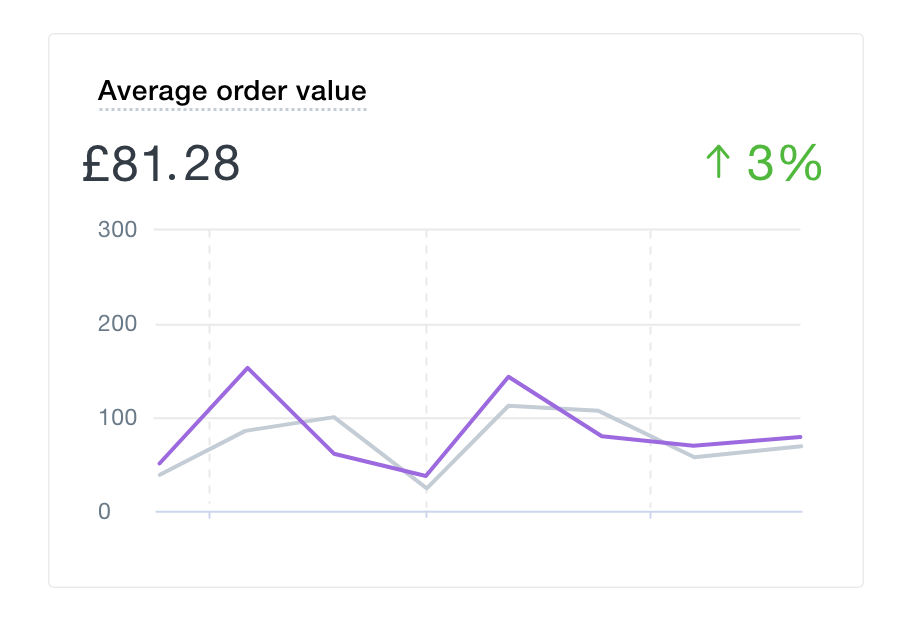
01. Average Order Value (AOV) report
Average order value is calculated by dividing the total value of your sales by the number of sales you make. However, Shopify reporting does not include returns in the calculation, providing a more accurate view of your store's performance.
In general, it is best to aim for a higher AOV. However, you should also check that an increase in order values does not cause a decrease in sales or returning customers.
02. Returning Customer Rate
Your returning customer rate is the proportion of your customers (within a selected date range) who have made a purchase at least once before.
There are lots of good reasons to prioritize your returning customer rate. One of the best predictors of a store’s long-term success is the proportion of returning customers it receives. From a marketing perspective, it is also more expensive to rely on acquiring new customers than it is to secure returning business. A study by the Harvard Business Review suggested that the cost of acquiring a customer was between 5 and 25 times more expensive than keeping a happy one.
03. Conversion Rate Report
Conversion Rate is the proportion of your store’s visitors who actually make a purchase. It is calculated by dividing the number of customers you receive by the number of sales you make and giving the answer as a percentage.
Shopify gives you the conversion rate for each stage of your “Conversion Funnel”. In this case, it is not the number of sales that are counted, but the number of customers who added an item to their cart or reached the checkout. These numbers are what you use to help calculate your cart abandonment rate.

04. Sessions Attributed to Marketing
The Basic Shopify plan comes with a standard “Sessions Attributed to Marketing” report. This report shows you the proportion of your visitors who arrive on your store from a link with a pre-set tracking parameter.
Social media and search engine ads come with UTM parameters on the end of your links. Shopify records the number of customers who arrive on your store with a pre-set UTM Campaign tag and compares this to your total visitors.
Read more: How To Add Google Analytics To Your Shopify Store
Attribution is a complicated process since customer behavior is rarely as straightforward as a simple sales funnel suggests. However, this report helps you to get a broad picture of how you are acquiring traffic.

05. Filters
Your reports can show you three different kinds of information:
- Types of customer
- Types of behaviour
- The amount of each of these that occur within your store
For example, you can see how many visitors (amount) browsed your store from a mobile device (type of customer). You can also see how many mobile browsers (amountand type of customer) made a purchase (type of behaviour). Filters let you create detailed reports by defining more specific types of customers.
IV. Filtering and Customizing Your Shopify Reports
You customize your Shopify reports with simple filtering and editing rules. These “Is” and “Is not” rules allow you to group your data into more specific types of visitors and behaviours.
01. Managing Your Filters
You can filter your data with “Is” and “Is not” rules based on 25 different attributes in the following categories:
- Device (browser, device, operating system)
- Landing Page (URL, path)
- Location (city, country)
- Marketing Campaign (marketing event, UTM parameters)
- Referrer (site, source, search terms)

02. Editing Your Reports
You can change the kinds of interactions and behaviors displayed in your reports by choosing what to add to the columns or contents. You can select from 34 types of information in the following categories:
- Sessions (bounce rate, session duration, visitors, page views, conversion rate, added to cart)
- Device
- Landing Page
- Location
- Marketing Campaign
- Referrer
If you are using the Advanced Shopify or Shopify Plus plan, you can save your customized reports, enhancing your Shopify professional reports by allowing you to track more specific metrics over time. That makes it easy to track more specific metrics over time. To save a customized report, apply the filtering and editing rules you need and click “Save as”.
If you are using a Basic, Shopify or Pro plan, you can still customize your reports, but will not be able to save them. If you want to create different kinds of reports, for example using your own tagging system, you can add a reporting app from the Shopify app store.
V. How To Optimize Your Store Using Shopify Reports
By making small changes and monitoring your Shopify reports on a continuous basis, you can optimize your store over time. These are some of the most useful reports to include when analyzing your store’s performance.
01. Reports To Optimize Your Marketing
PPC, SEO and Affiliate Marketing:
Customizing a “Sessions Over Time” report, by adding columns for Referrer Source, Referrer Site and Conversion Rate, will allow you to see how many visitors each of your marketing channels is bringing to your store. It will also show what proportion of visitors from each channel end up making a purchase. For more detailed insights, you can add columns for UTM Campaign Source and Referrer Search Terms.
Organic And Paid Search:
You can also get useful information on the search terms that lead people to your Shopify store with the “Sessions Over Time” report. This time, your filters will be slightly different. You should create columns for Referrer Site, Conversion Rate and Referrer Search Terms. To remove any irrelevant data, create a filter for Referrer Site and select your chosen search engines.

Another way to get useful information for SEO and search engine advertising is to explore your “Visitors By Landing Page” report. Remove the Landing Page Path column and replace it with columns for Conversion Rate, Bounce Rate and Referrer Search Term.
02. Reports To Optimize Your User Experience (UX)
One of the most valuable reports to use for improving your user experience is the “Top Online Store Searches” report. As long as your Shopify theme includes a search bar, this report shows you which keywords visitors searched for whilst browsing your site.
This information may seem unnecessary, and it is only representative of a small portion of your traffic. Despite this, it can give you fantastic insights into who your customers are and how they think.
- What To Call Your Products:If you see a clear pattern emerging in the terms your users search for, you should make sure they are present in your product titles. Not only will that make it easier for your visitors to find them, but it will also improve your SEO.
- Which Products to Stock: If your inventory is missing something that people are searching for, there’s a good chance you’re missing out on a lot of customers.
- Where the Problems Are: If your visitors are struggling to find the same thing, there may be a problem with the UX for your store.
VI. View Product Analytics Dashboard
Most store owners ask the same kinds of questions whenever it is time to restock. You need to know which products are selling and why. Whilst the reports shown in your Shopify analytics will not give you all the information you need, you can view individual product reports that tell you how that product is performing.
To see a report for an individual product, go to the “Products” section of your Shopify admin and navigate to the product you want. From there, click the “Insights” widget and then “View details”.
Shopify gives you the following information about each product:
- Net Sales (unit price multiplied by units sold, minus discounts/returns)
- Sales Breakdown (total sales minus discounts/returns, with full breakdown)
- Net Sales by Channel (which sales channels sold the most of this product)
- Net Units Sold by Traffic Source (which traffic sources sold the most of this product)
- Customers (returning vs new customers)
Using Shopify analytics effectively can help you make informed decisions about inventory management and product performance.

Conclusion
Understanding your Shopify store will help you make better decisions. Your store’s data, accessible through Shopify basic reports and Shopify professional reports, can show you how your customers think about the products you sell and how they want your store to work. Not only will this allow you to optimize your store, but it will also show you the direction you need to take it in through effective Shopify reporting. Utilizing Shopify analytics, your store’s data can show you how your customers think about the products you sell and how they want your store to work. Not only will this allow you to optimize your store, but it will also show you the direction you need to take it in.
Author Bio
Stephen Courtney is a conversion rate optimization specialist with a background in digital experimentation and technical SEO. His passion is combining numbers with new ideas to help businesses tell better stories.
Shopify Reports Analytics Guide FAQ
Shopify reports are tools that help store owners analyze their sales, customers, and marketing performance. These reports provide insights into various aspects of your business, helping you make informed decisions.
Shopify analytics can help your store by providing detailed data on customer behavior, sales trends, and marketing effectiveness. This information can be used to optimize your store’s performance and increase profitability.
Shopify basic reports are available on the Basic Shopify plan and include essential metrics such as sales over time, product analytics, and customer reports. These reports provide a foundational understanding of your store’s performance.
Shopify professional reports are available on higher-tier plans and offer advanced insights, including custom reports, detailed sales analytics, and customer segmentation. These reports help in making more strategic business decisions.
Shopify reporting is important because it enables store owners to track key performance indicators, understand customer behavior, and measure the effectiveness of marketing campaigns. Accurate reporting is crucial for the growth and success of your business.